Global Portfolio Strategy-June 2024
The LPL Strategic & Tactical Asset Allocation Committee (STAAC) determines the firm’s investment outlook and asset allocation that helps define LPL Research’s investment models and overall strategic and tactical investment thinking and guidance. The committee is chaired by the chief investment officer and includes investment specialists from multiple investment disciplines and areas of focus. The STAAC meets weekly to foster a close monitoring of all global economic and capital markets conditions to ensure that all the latest information is being digested and incorporated into its investment thought.
  |
 |
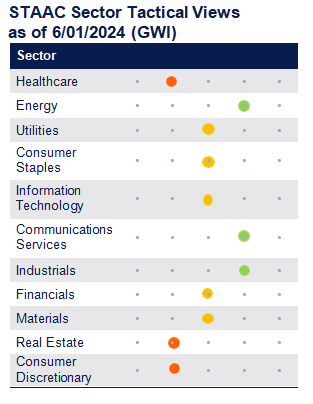
Key Changes from May Report:
- Slightly upgraded economic growth as business capital spending, especially in R&D, could provide a boost throughout the year.
- Upgrade industrials to overweight from
- Upgraded consumer staples to neutral from underweight
- Downgraded healthcare and consumer discretionary from neutral to underweight.
Source: STAAC as of June 1, 2024. All sector and asset allocation recommendations must be considered in the context of an individual investor’s goals, time horizon, liquidity needs and risk tolerance. Not all recommendations will be in the best interest of all investors. The STAAC views expressed are based on a Tactical Asset Allocation (TAA) for a portfolio that has a Growth With Income (GWI) investment objective
INVESTMENT TAKEAWAYS
Stocks rebounded nicely in May, recovering April's losses as the S&P 500 returned 5% for the month. At a high level, economic and profit growth outweighed concerns about the Federal Reserve’s (Fed) "higher for longer" rate messaging. As June began, Treasury yields drifted lower as economic growth softened and consumers started to push back on high prices, helping equities stay afl oat despite rich valuations.
Within fixed income markets, falling Treasury yields helped high-quality sectors, such as agency mortgage-backed securities and investment grade corporates, outperform the riskier segments of the fixed income markets (high yield bonds in particular). Market pricing for expected Fed rate cuts continues to be volatile but we think is currently more in line with actual Fed intentions. As such, unless the Fed surprisingly pushes back on rate cut expectations at the June Fed meeting, we're likely past cycle highs for interest rates.
The LPL Research STAAC sees the risk/reward trade-off between equities and fixed income as roughly balanced, with a slight edge to fixed income as higher bond yields increase its relative attractiveness. While the economic and profit growth backdrop generally remains favorable for equities, fixed income may have a bit more upside over the next six months based on elevated stock valuations.
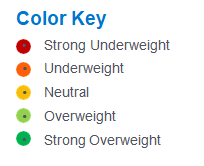
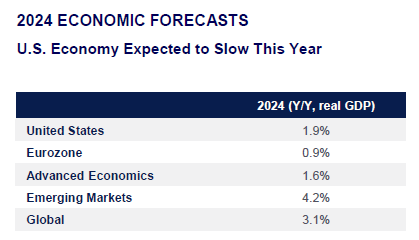
- Economic growth in the U.S. should outperform other developed markets. Despite a slow start and some headwinds to consumer spending, we expect solid business capital spending to support domestic growth overall albeit at below consensus
- The STAAC maintains its recommended neutral equities allocation amid a favorable economic and profit Interest rates may need to fall for valuations to hold, so potential second half gains are more likely to be driven by earnings growth.
- The Committee remains comfortable with a balanced approach to market High-quality small cap stocks are attractively valued, but the earnings power among large cap companies, overall, has been very impressive.
- The Committee maintains a slight preference towards large cap growth with economic growth poised to slow. Earnings dominance from growth companies as the artificial intelligence (AI) buildout accelerates and lower interest rates favor the growth style.
- The STAAC’s regional preference remains S. over developed international and emerging markets (EM) due largely to superior earnings and economic growth in the U.S. and as political uncertainty ratchets higher in EM.
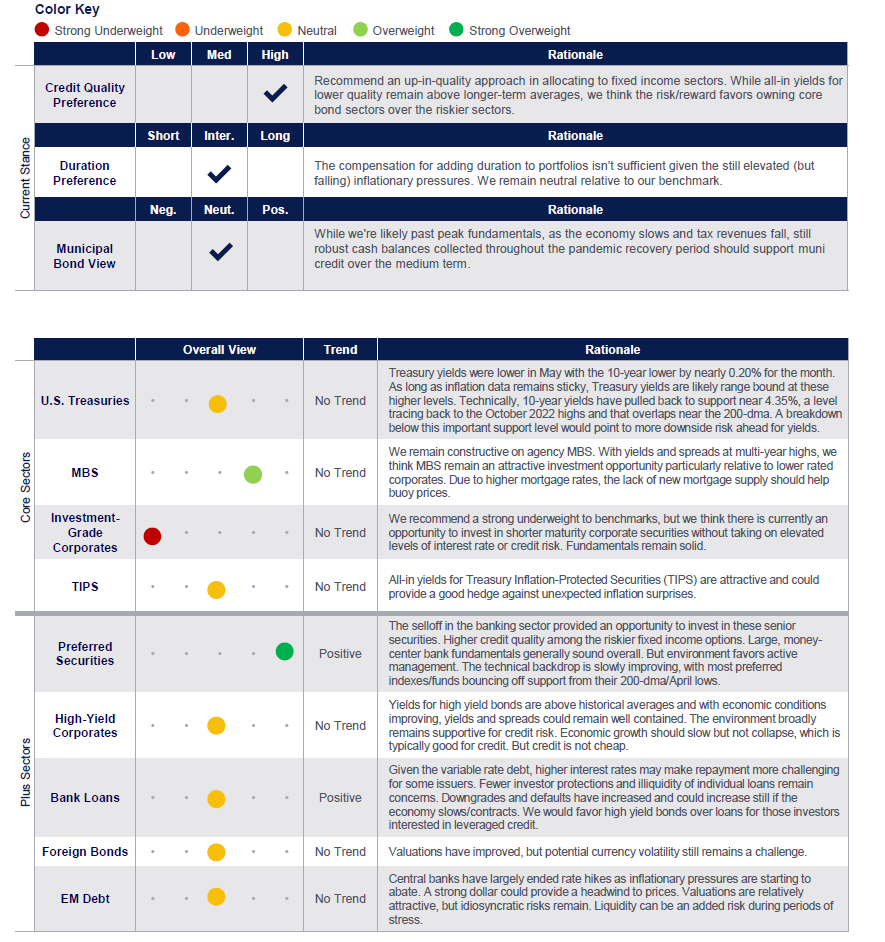
- The STAAC continues to hold a strong overweight tilt in preferred securities as valuations remain attractive. However, the risk/reward for core bond sectors (U.S. Treasury, agency mortgage-backed securities (MBS), investment-grade corporates) is more attractive than plus sectors. In our view, adding duration isn't attractive due to persistent (but subsiding) inflationary pressures, and the STAAC remains neutral relative to our benchmarks.
Source: LPL Research, FactSet, Bloomberg
All indexes are unmanaged and cannot be invested into directly. The economic forecasts may not develop as predicted.
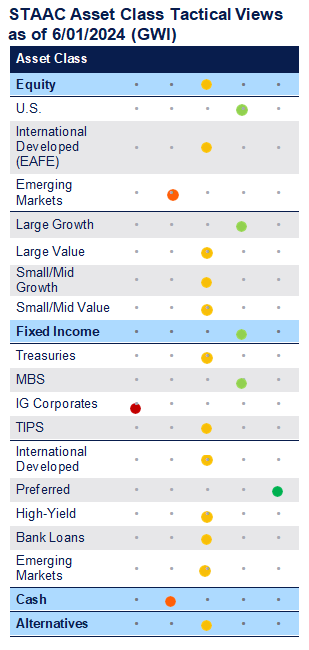
*Our year-end 2024 forecast for the U.S. 10-year Treasury yield is 3.75% to 4.25%. The Fed’s higher for longer narrative and the poor supply/demand technicals for Treasury securities will likely keep interest rates at these elevated levels until the economic data weakens and/or inflation falls back in line with the Fed’s longer term 2% target.
**Our year-end 2024 fair-value target range for the S&P 500 of 4,850-4,950 is based on a price-to-earnings ratio (PE) of 19.5 and our S&P 500 earnings per share (EPS) forecast of $250 in 2025.
Any forward-looking statements including economic forecasts may not develop as predicted and are subject to change.
Source: LPL Research, Bloomberg
The economic forecasts may not develop as predicted.
All data, views, and forecasts herein are as of 06/01/24.
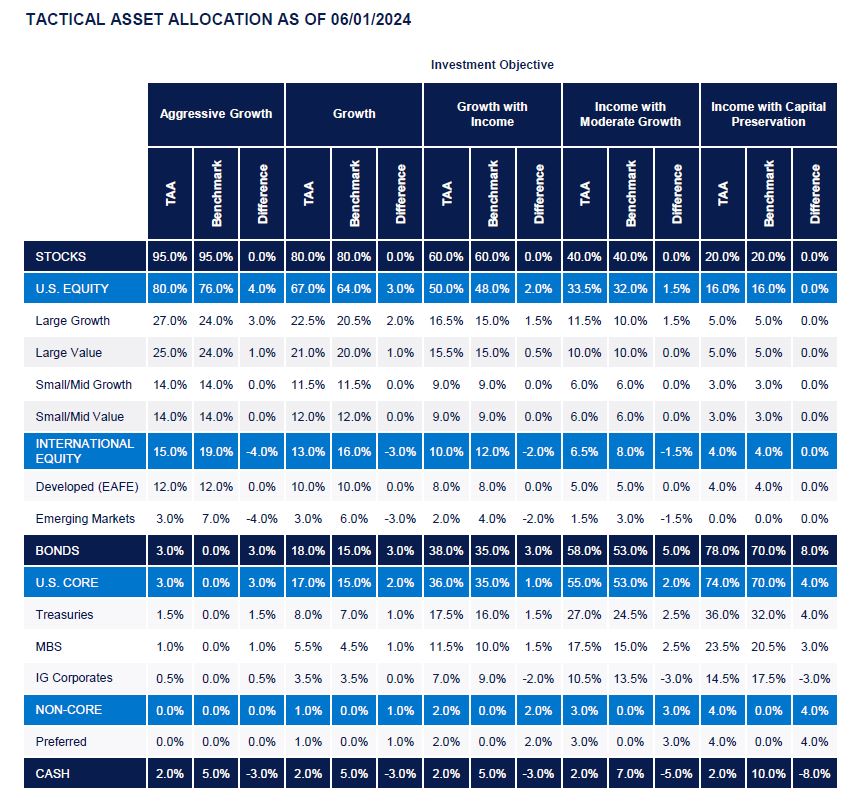
For investors who have their own benchmarks, we would recommend emphasizing underweights or overweights relative to the individual benchmark at the most similar overall risk level.
Equity benchmark style weights are equally distributed across growth, core, and value. Cap weights are based on the underlying holdings of the domestic benchmark indexes.
Bond benchmark sector allocations are based on a look-through analysis of the major sector components of the Bloomberg US Aggregate Bond Index. Treasuries include other government related debt. MBS includes other securitized debt.
Abbreviations: TAA - tactical asset allocation; MBS - mortgage-backed securities; IG corporates - investment-grade corporates; TIPS - Treasury inflation- protected securities.
EQUITY ASSET CLASSES
Favor U.S. Amid Rising Political Uncertainty in Emerging Markets
The STAAC maintains its recommended neutral equities allocation amid a favorable economic and profit backdrop. Interest rates may need to fall for valuations to hold, so potential second half gains are more likely to be driven by earnings growth.
The Committee remains comfortable with a balanced approach to market cap. High-quality small cap stocks are attractively valued,
but the earnings power among large cap companies, overall, has been very impressive.
The Committee maintains a slight preference towards large cap growth with economic growth poised to slow. Earnings dominance from growth companies, as the AI buildout accelerates, and lower interest rates favor the growth style.
The Committee favors U.S. equities over developed international and emerging markets (EM), despite a favorable outlook for Japan, due largely to superior earnings and economic growth in the U.S. as EM political risk ratchets higher. Other risks include further upward pressure on inflation and interest rates, a broader conflict in the Middle East or Europe, and escalation in U.S.-China tensions.
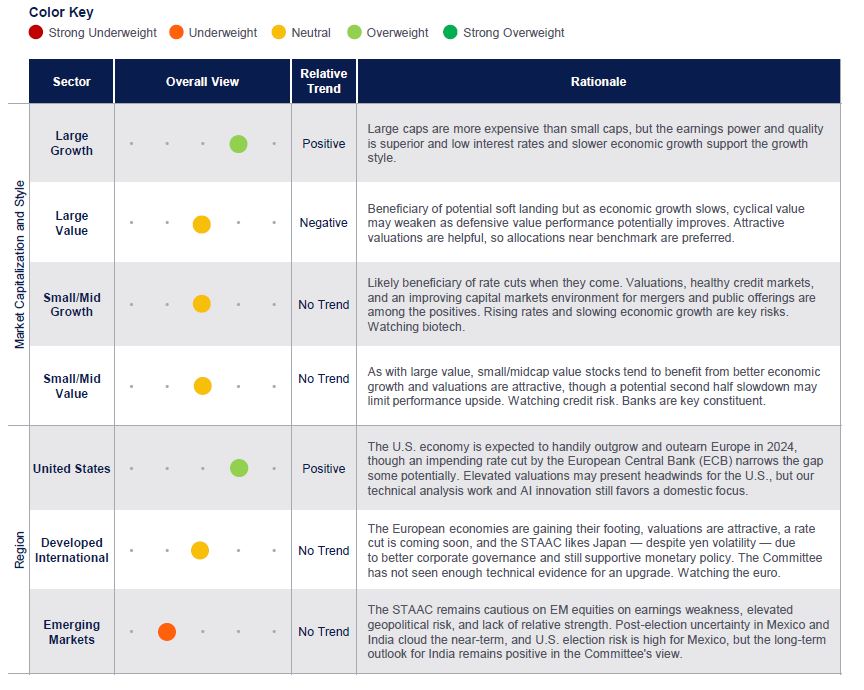
Relative trend is an assessment of the intermediate term price trend and performance between various asset classes and sectors. For regions and styles, the relative trends are compared to each other.
EQUITY SECTORS
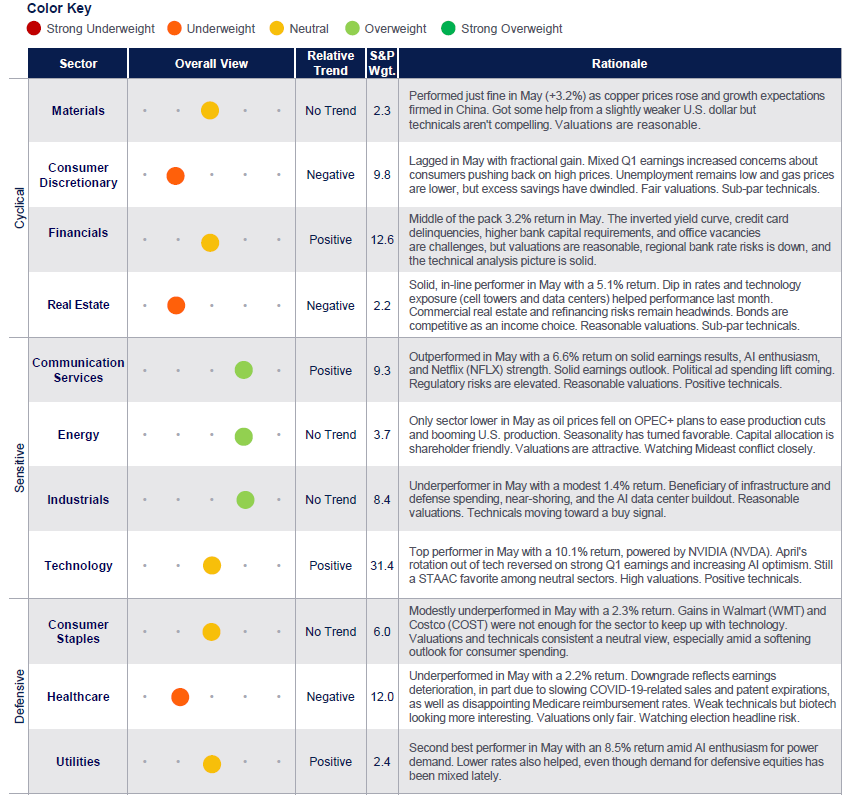
Upgrading Industrials and Consumer Staples, Downgrading Consumer Discretionary and Healthcare
The STAAC continues to recommend a slight cyclical tilt over defensive sectors broadly, even after this month's changes. The Committee's industrials upgrade reflects opportunities in infrastructure, defense, and near-shoring. The consumer staples upgrade reflects the Committee's desire to remain balanced across cyclicals and defensives as well as stabilized fundamentals. Continued earnings disappointments and a weakening technical analysis picture underpin the healthcare downgrade, while risks are building for consumer discretionary as pandemic-era excess savings are spent and consumers increasingly push back on high prices and
low big-ticket purchases. The Committee still favors communication services and energy and recommends an underweight to real estate.
FIXED INCOME
Bonds Rebounded in May
Fixed income markets, as proxied by the Bloomberg Aggregate Bond Index, rebounded nicely in May with the index higher by 1.7% for the month. Softening economic data and the return of the disinflation narrative pushed Treasury yields lower (prices higher). While Fed rate cut expectations continue to be volatile, unless inflationary pressures reignite, we think we're likely past peak interest rate levels for this cycle. However, while our 2024 yearend target for the 10-year is 3.75% to 4.25% we acknowledge that we could stay above those levels until later this year.
Aside from preferred securities, valuations for riskier fixed income sectors remain rich relative to core sectors, in our view. And while price appreciation may be limited until inflationary pressures abate, income levels remain attractive.
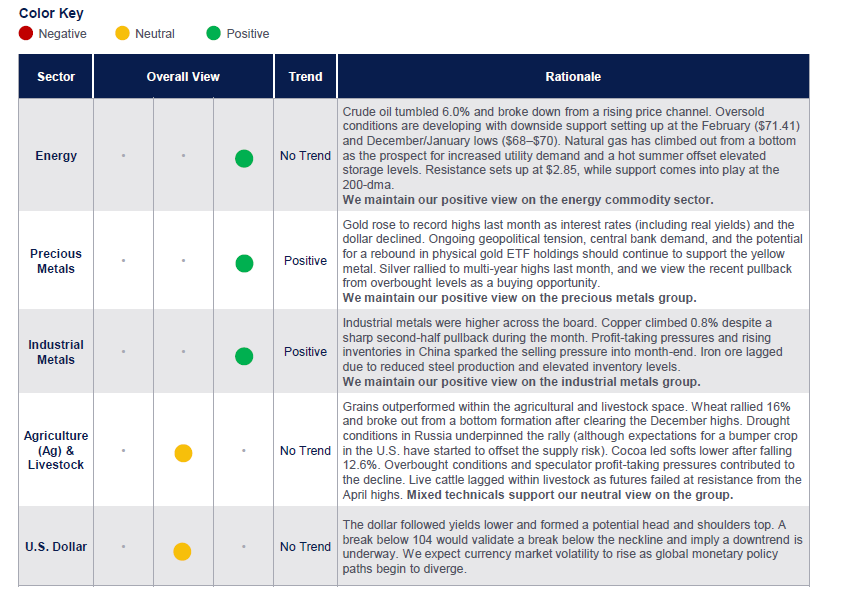
COMMODITIES AND CURRENCIES
Commodity Markets Climb for a Third Straight Month
The broader commodities complex rose for a third straight month in May. The Bloomberg Commodity Index (BCOM) added 1.3% despite a 2% drop during the final week of trading. Buying pressure was relatively widespread as April reflation fears dissipated into the prospect of disinflation and easing monetary conditions. Global economic data remained resilient, and signs of life conti nued to emerge in China’s stimulus-supported recovery. Imports and exports rose faster than expected in China, while rising industrial production helped offset a weak manufacturing PMI print. Technically, evidence for a bottom is building in BCOM but remains insufficient to confirm a new uptrend is underway.
A decline in the dollar also helped support commodity prices last month. The U.S. Dollar Index dipped 1.5% and posted its first monthly decline of the year. The greenback followed yields lower as signs of receding pricing pressures renewed hope for inte rest rate cuts this year. Last month’s pullback took out support at the 200-day moving average and a potential top formation has formed. Expectations for elevated currency market volatility are also ticking higher due to developed divergences in policy among cen tral banks.
Metals were a bright spot last month after picking up tailwinds from the weaker dollar. Precious metals were led higher by a 15.7% rally in silver. Prices soared to multi-year highs as rising solar technology demand sapped up supply. Gold added 1.8% and notched record highs intramonth. Industrial metals were higher across the board. Copper climbed 0.8% despite a sharp second-half pullback during the month. Profit-taking pressures and rising inventories in China sparked the selling pressure into month-end. Iron ore lagged due to reduced steel production and elevated inventory levels.
Natural gas widely outperformed within the energy complex. The return of cooling demand and forecasts calling for a potential ly hot summer underpinned the rally. The prospect of increased utility demand due to the proliferation of data center electricity consumption further added to the rally. Crude oil tumbled 6.0% and broke down from a rising price channel. Oil’s risk premium faded due to limited escalation in the Israel-Hamas war. Rising stockpiles in the U.S. coupled with OPEC+’s decision to begin unwinding production cuts earlier than expected have also weighed on prices.
Any futures referenced are being presented as a proxy, not as a recommendation. The fast price swings in commodities will result in significant volatility in an investor’s holdings. Commodities include increased risks, such as political, economic, and currency instability, and may not be suitable for all investors.
ALTERNATIVE INVESTMENTS
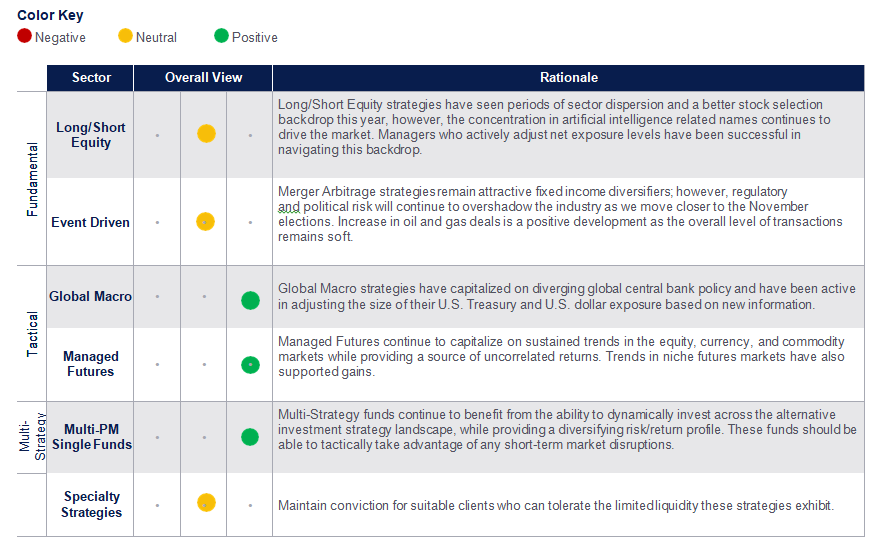
Alts Underperform Broad Market Rally
Mixed Alternative Investment Performance. Alternative investment strategies underperformed traditional long-only equity and bond markets (+4.9 and +1.3%, respectively), however, year to date, the industry has performed well and continues to act as source of diversification and downside protection for portfolios.
Fundamental Strategies Lead Gains. Long/Short Equity strategies led sub-category returns (HFRX Equity Hedge +1.3%) given their higher level of market exposure. While these strategies have benefitted from price gains in AI-related stocks this year, of late, the industry has seen selling in many of these names as managers take profits by reducing their long exposure. Broadly speaking, short exposure was a headwind during the month given the widespread rally. Event-Driven strategies were flat to slightly positive and benefitted from the markets move higher. The mergers and acquisitions environment remains soft, except for the oil and gas industry. Following a robust Q1 2024, Q2 has also been strong with ConocoPhillips announcing an all-stock deal to buy Marathon Oil at the end of May. Whether or not this is an industry-specific trend or the beginning of a larger pickup in deals remains to be seen, however, it’s a positive development for the category that has been starved for deals.
Remain Constructive on Global Macro, Managed Futures, and Multi-Strategy. While our preferred methods of implementation faced a difficult month, we maintain our conviction levels. Within the Managed Futures space, short U.S Treasury and long WTI/Brent crude exposure were the largest detractors, as Treasuries rallied, and oil markets declined during the month. The largest positive contributors were long equity and silver positioning which were able to marginally offset these losses. To a lesser extent, Global Macro strategies were also impacted by these market moves, however, these managers were faster in adjusting their U.S. Treasury shorts and able to cut losses faster. Going forward, we expect large macro events, market repricing, and an increased risk of policy errors to provide ongoing opportunities for skilled managers in the macro space. With interest rates staying higher for longer, these strategies will also continue to benefit from their investments in short-term debt as collateral for their futures exposure.
Please see https://www.hfr.com/indices for further information on the indices
Definition: The HFRI 400 (US) Hedge Fund Indices are global, equal-weighted indices comprised of the largest hedge funds that report to the HFR Hedge Fund Research
IMPORTANT DISCLOSURES
This material has been prepared for informational purposes only, and is not intended as specific advice or recommendations for any individual. There is no assurance that the views or strategies discussed are suitable for all investors and they do not take into account the particular needs, investment objectives, tax and financial condition of any specific person. To determine which investment(s) may be appropriate for you, please consult your financial professional prior to investing. Any economic forecasts set forth may not develop as predicted and are subject to change.
Stock investing involves risk including loss of principal. Because of their narrow focus, sector investing will be subject to greater volatility than investing more broadly across many sectors and companies. Value investments can perform differently from the market as a whole and can remain undervalued by the market for long periods of time. The prices of small and mid-cap stocks are generally more volatile than large cap stocks. Bonds are subject to market and interest rate risk if sold prior to maturity.
ASSET CLASS DISCLOSURES
Because of its narrow focus, specialty sector investing, such as healthcare, financials, or energy, will be subject to greater volatility than investing more broadly across many sectors and companies. Relative trend is an assessment of the intermediate term price trend and performance between various asset classes and sectors. For sectors each sector’s relative trend is versus the S&P 500.
Yield spread is the difference between yields on differing debt instruments, calculated by deducting the yield of one instrument from another. The higher the yield spread, the greater the difference between the yields offered by each instrument. The spread can be measured between debt instruments of differing maturities, credit ratings, and risk. Bank loans are loans issued by below investment-grade companies for short-term funding purposes with higher yield than short-term debt and involve risk. For the purposes of this publication, intermediate-term bonds have maturities between three and 10 years, and short-term bonds are those with maturities of less than three years.
Bond values will decline as interest rates rise and bonds are subject to availability and change in price. Corporate bonds are considered higher risk than government bonds. Municipal bonds are subject to availability and change in price. Interest income may be subject to the alternative minimum tax. Municipal bonds are federally tax-free but other state and local taxes may apply. If sold prior to maturity, capital gains tax could apply. U.S. Treasuries may be considered “safe haven” investments but do carry some degree of risk including interest rate, credit, and market risk. Bond yields are subject to change. Certain call or special redemption features may exist which could impact yield. Mortgage-backed securities are subject to credit, default, prepayment, extension, market and interest rate risk.
Municipal bonds are subject to availability and change in price. They are subject to market and interest rate risk if sold prior to maturity. Bond values will decline as interest rates rise. Interest income may be subject to the alternative minimum tax. Municipal bonds are federally tax-free but other state and local taxes may apply. If sold prior to maturity, capital gains tax could apply.
High yield/junk bonds (grade BB or below) are not investment grade securities, and are subject to higher interest rate, credit, and liquidity risks than those graded BBB and above. They generally should be part of a diversified portfolio for sophisticated investors.
Floating rate bank loans are loans issues by below investment grade companies for short term funding purposes with higher yield than short term debt and involve risk.
Credit Quality is one of the principal criteria for judging the investment quality of a bond or bond mutual fund. Credit ratings are published rankings based on detailed financial analyses by a credit bureau specifically as it relates to the bond issue’s ability to meet debt obligations. The highest rating is AAA, and the lowest is D. Securities with credit ratings of BBB and above are considered investment grade. Duration is a measure of the sensitivity of the price (the value of principal) of a fixed- income investment to a change in interest rates. It is expressed as a number of years.
Preferred stock dividends are paid at the discretion of the issuing company. Preferred stocks are subject to interest rate and credit risk. As interest rates rise, the price of the preferred falls (and vice versa). They may be subject to a call feature with changing interest rates or credit ratings.
Alternative investments may not be suitable for all investors and should be considered as an investment for the risk capital portion of the investor’s portfolio. The strategies employed in the management of alternative investments may accelerate the velocity of potential losses. Alternative investments are include non-traditional asset classes. This may include hedge funds, private equity/debt/credit, etc. This may also include Business Development Companies (BCDs) and Opportunity Zone investments. These are not registered securities and there may be significant restrictions on purchase and suitability requirements. Please contact your advisor for any further information.
Event driven strategies, such as merger arbitrage, consist of buying shares of the target company in a proposed merger and fully or partially hedging the exposure to the acquirer by shorting the stock of the acquiring company or other means. This strategy involves significant risk as events may not occur as planned and disruptions to a planned merger may result in significant loss to a hedged position. Managed futures are speculative, use significant leverage, may carry substantial charges, and should only be considered suitable for the risk capital portion of an investor's portfolio.
Commodity-linked investments may be more volatile and less liquid than the underlying instruments or measures, and their value may be affected by the performance of the overall commodities baskets as well as weather, geopolitical events, and regulatory developments. The fast price swings in commodities and currencies will result in significant volatility in an investor’s holdings. Any futures referenced are being presented as a proxy, not as a recommendation. Commodities include increased risks, such as political, economic, and currency instability, and may not be suitable for all investors. Precious metal investing involves greater fluctuation and potential for losses.
Investing in foreign and emerging markets securities involves special additional risks. These risks include, but are not limited to, currency risk, geopolitical risk, and risk associated with varying accounting standards. Investing in emerging markets may accentuate these risks. All information is believed to be from reliable sources; however, LPL Financial makes no representation as to its completeness or accuracy. Precious metal investing involves greater fluctuation and potential for losses.
Earnings per share (EPS) is the portion of a company’s profit allocated to each outstanding share of common stock. EPS serves as an indicator of a company’s profitability. Earnings per share is generally considered to be the single most important variable in determining a share’s price. It is also a major component used to calculate the price-to-earnings valuation ratio.
Gross Domestic Product (GDP) is the monetary value of all the finished goods and services produced within a country’s borders in a specific time period, though GDP is usually calculated on an annual basis. It includes all of private and public consumption, government outlays, investments and exports less imports that occur within a defined territory.
All index data from FactSet.
The Strategic and Tactical Asset Allocation Committee (STAAC) is a division of LPL Research.
Securities and advisory services offered through LPL Financial (LPL), a registered investment advisor and broker/dealer (member
FINRA/SIPC). Insurance products are offered through LPL or its licensed affiliates. To the extent you are receiving investment advice from a
separately registered independent investment advisor that is not an LPL Financial affiliate, please note LPL Financial makes no representation with
respect to such entity.
| Not Insured by FDIC/NCUA or Any Other Government Agency |
Not Bank/Credit Union Guaranteed |
Not Bank/Credit Union Deposits or Obligations |
May Lose Value |
Comments